Friday, April 26, 2024
Home Blog Page 4

The Olympic Games for Education – The Global Academic Awards

0

The Olympic Games for Education – The Global Academic Awards

Over 200 nations compete this summer, to see who has the best education system in the world.

The world’s greatest sporting event, the Summer Olympics Games will take place next month, a year late because of COVID-19. As countries compete to see who is the best in swimming, gymnastics, track and field, boxing, and archery.

The world will be exposed to a new event to see what nation has the best early childhood, primary, lower-secondary, high school, and college education levels.

You say education is not a sport. Not a show of endurance training and dedication. I say you are a fool not to think so.

The time has come for nations to face the reality education is the most important feet to accomplish and behold. Where nations can be tested and admired for their commitment, to stand alone for developing the best of the best.

The Award’s competition was born to support the United Nation’s Sustainable Development Goal (SDG) Initiative that asks nations to improve the lives of the people in their country by the year 2030.

The UN’s SDG education mission is to ensure inclusive and equitable quality education and promote lifelong learning opportunities for all. Well, the Global Academic Awards will test each nation’s ability to accomplish those talents.

And you have a front-row see to see who comes out on top this summer.

Who Are You?

In the Global Academic Awards, no one individual or team represents their country. It is not that simple. It will be the whole government and their system to develop human capital. That means our children, teachers, and schools’ performance will determine who is the winner and losers.

The participants in this competition will be the nation’s current education statistics from – early childhood enrollment rates, primary completion rates, lower-secondary completion rates, high school graduation rates, and college graduation rates.

Using basic percentage calculations and sorting each nation’s data into sections. The data represent reported international data for Primary and Lower-Secondary education levels from 2015 to 2018, by WDI and UNESCO. From 2016 through 2018, the Early Childhood, High School, and College education data were collected by the OECD and UNESCO.

The data come from each country’s self-reporting to the UN’s from the above-mentioned international educational data collection platforms.

So the data are the latest reported education data, according to each nation.

Let the Games Commence

The Global Academic Awards winners are chosen based on the education data they present and how it compares to that of other countries.

To reach the awards, the nation that successfully completes its geographical area competition must compete in five rounds.

The format is as follows:

Intercontinental – All Countries
Continental Round- 60 Countries
First Round- 24 Countries
Second Round – 12 Countries
Semi-Final Round- 6 Countries
Medal Round – 4 Countries

The eight continents where the tournament begins are Africa, Asia, Europe, Central America, North America, South America, Oceania, and the Caribbean.

Sixty countries are eligible to advance to the Continental round.

The first round will be contested by twenty-four nations from the continent round. After that, 12 countries will advance to the second round. The top six countries from the second round advance to the semi-finals. Winner medals will be awarded to the four countries with the highest educational levels and overall point total.

Who Will Be Our Winners?

Awards are a way of recognizing someone’s accomplishments. Of attaining a level that no one else has. The goal of the Global Academic Awards is to inspire and encourage nations to achieve greatness, which will need everyone’s participation. Everyone, no matter how big or small, can contribute to success.

Education will capture the nation’s attention and make its presence felt in 2021. It will never be underestimated again!

We want to know the outcomes wherever a book can be opened, from Africa’s scorching heat to Antarctica’s cold permafrost.

Predictions about who will win begin at the local level, progressing to the region, and then to the global stage.

This is where we begin: Africa.

Africa is divided into five geographical regions. Three countries will advance to the Continent round from each area. The most stable countries in the eastern part of the country are Kenya, Tanzania, and Uganda. Sao Tome and Principe, Gabon, and Cameroon, are located in Central Africa, are the most stable countries in that region.

Egypt, Algeria, and Tunisia, all from the northern part of Africa, are powerful nations on the continent. South Africa, Namibia, and the formal nation known as Swaziland – eSwatini – are all countries in Southern Africa that should have excellent educational systems. Ghana, Nigeria, and Sierra Leone should be the representatives from Western Africa.

Ghana, Kenya, and Egypt should be the three countries that emerge from the Continent round and represent Africa. These three countries have the most advanced educational infrastructure in the region.

Asia

Asia, like Africa, is divided into five major geographical regions. Powerhouse nations like China, Japan, and South Korea dominate the East, and they should represent the region. Kyrgyzstan, Turkmenistan, and Uzbekistan are solid countries in Central Asia that should advance. India, Nepal, and Sri Lanka should be given priority in South Asia.

Singapore, Indonesia, Vietnam, Israel, Saudi Arabia, and Kuwait should qualify for the Continent round from Southeast and Western Asia.

South Korea, Japan, and China should be the three Asian countries represented.

Europe

Europe is divided into three geographical zones. Finland, Denmark, Sweden, Estonia, Iceland, the Netherlands, and the United Kingdom are among the northern countries. However, only three countries can proceed. Finland, Denmark, and the United Kingdom are the countries we expect to continue.

From the south, it appears that France, Belgium, and Italy have the upper hand. Russia is a shoo-in from Eastern Europe, but Germany and Poland should move on as well.

Russia, Finland, and Denmark are expected to be the three countries representing Europe.

North America

Only four teams can qualify to compete in the Global Academic Awards. So the three countries favored representing the Continent are – the USA, Canada, and Mexico.

South America

Like North America, there will only be the Continent Round winners representing them in the next round. The three favors to move on are Brazil, Chile, and Argentina.

Central America

Only three winners of the Continent Round advance to the next round of the competition. Costa Rica, Guatemala, and Belize are the three predicted winners.

Oceania

Oceania is divided into three geographical areas. Australia, New Zealand, and the Solomon Islands are the selections from Australasia. Kiribati, Nauru, and Palau are expected to advance from Micronesia. Tuvalu, Samoa, Tokelau, and American Samoa are expected to win the Polynesia region.

Australia, New Zealand, and Kiribati are expected to be the three Continent winners.

The Caribbean

The three countries expected to represent the Caribbean are Puerto Rico, Cuba, and the British Virgin Islands.

The Countdown to the Finals

Countries move on to the international stages after completing their continental rounds. Countries will be seeded from their Continentals in the first round.

This year’s seeding is as follows:

  1. Africa
  2. Asia
  3. Europe
  4. North America
  5. South America
  6. Central America
  7. Oceania
  8. The Caribbean

Then placed in four groups:
1 vs. 8
2 vs. 7
3 vs. 6
4 vs. 5

Ghana, Kenya, and Egypt are expected to be the top three nations in Groups 1 and 8. All three Asian nations – South Korea, Japan, and China – should win Groups 2 and 7. All three European nations – Russia, Finland, and Denmark – should be in the top three in Groups 3 and 6. In Groups 4 and 5, the United States, Canada, and Chile should advance to the next round.

The nations in Groups 1 and 8 and Groups 4 and 5 will compete:
Ghana, Kenya, and Egypt, the United States, Canada, and Chile

The nations in Groups 2 and 7 and Groups 3 and 6 will compete:

South Korea, Japan, and China, Russia, Finland, and Denmark

The Semi-Finals are expected to feature Group 1 and 8 and Group 4 and 5 winners – the United States, Canada, and Chile. Finland, South Korea, and Russia are expected to be the winners from Groups 2 and 7, and Groups 3 and 6.

The Final Six

All six countries will be matched in the Semi-Final Round, with four countries advancing to the medal rounds.

You have Finland, which has been voted the best educated country in the world for the past decade. Four out of seven years, the annual World Top 20 Education Poll has named South Korea as having the strongest education system. Next, we have the United States, which spends over $700 billion a year on education.

Because of their history of educational innovation dating back to the first century, Russia may have the best chance of earning the first gold medal at The Global Academic Awards. How about Canada, which has boosted its investment in modern educational technology? Last but not least, Chile, a rising force in Latin America, where does it stand in terms of educational growth?

Who will win the gold medal in Early Childhood, Primary, Lower-Secondary, High School, and College education levels? Only six countries hold the answer to that question.

Which country will win the overall medal count and points to be declared the best educated country in the world? We will find out on August 22, 2021.

DATA SOURCE:

The international data used was collected from the following sources:

  1. Early Childhood Enrollment Rate – the number of 3 and 5-year old children in the country that were enrolled in early education. The Organisation for Economic Co-operation and Development (OECD) & United Nations Educational, Scientific, and Cultural Organization (UNESCO) Institute for Statistics
  2. Primary School Completion Rate – the percentage of 6 to 11-year old that completed 5 years of education in their country. World Development Indicators (WDI) & United Nations Educational, Scientific, and Cultural Organization (UNESCO) Institute for Statistics
  3. Secondary School Completion Rate – the percentage of 12 to 14-year old that completed 8 years of education in their country. World Development Indicators (WDI) & United Nations Educational, Scientific, and Cultural Organization (UNESCO) Institute for Statistics
  4. High School Graduation Rate – the percentage of 15 to 18-year old that completed 12 years of education in their country. The Organisation for Economic Co-operation and Development (OECD) & United Nations Educational, Scientific, and Cultural Organization (UNESCO) Institute for Statistics
  5. College Graduation Rate – the percentage of 19 to 24-year old that completed 13 years or more of education in their country. The Organisation for Economic Co-operation and Development (OECD) & United Nations Educational, Scientific, and Cultural Organization (UNESCO) Institute for Statistics

Data, Data, Data, Is the Answer to the Problem for Decision-Makers

0

Data, Data, Data, Is the Answer to the Problem for Decision-Makers

All the world problems can be solved, IF. We look at the facts. The core factored that is causing the problem. There would be no guessing. Now that we’ve identified the problem, let’s get to work on resolving it.

Without accurate information or data, whoever is in charge can say it is not my fault. I only did what seemed to be right. You cannot blame me, I only followed the facts.

An easy excuse to not get anything done, you can always blame the messenger.

So the problem grows and grows; now it cannot be fixed. What a shame.

Four Steps to Fixing Your Bad Data

Africa’s education crisis seldom makes media headlines or summit agendas and analysis by the Brookings Center for Universal Education (CUE) explains why this needs to change. With one-in-three children still out of school, progress towards universal primary education has stalled. Meanwhile, learning levels among children who are in school are abysmal. Using a newly developed Learning Barometer, CUE estimates that 61 million African children will reach adolescence lacking even the most basic literacy and numeracy skills. Failure to tackle the learning deficit will deprive a whole generation of opportunities to develop their potential and escape poverty. And it will undermine prospect for dynamic growth with shared prosperity. Read More:

SOURCE: Brookings

The Facts are the Facts. Or are they?

How is data gathered to determine the world’s most pressing issue? Who is in charge of keeping us updated? Is that individual or method the best we can do with what we have?

Data is used to make the majority of economic, social, and environmental predictions. Surveys, censuses, and man-made technologies are being used to collect the data.

As a result, these processes influence all of the world’s most critical decisions. We have confidence in the system, good or poor. Unfortunately, the majority of the information in these systems is outdated. They are three, four, or five years old, respectively.

Therefore, we rely on what can happen, if this happens based on the data we have. Keeping our fingers cross it works.

Better data, better policy making

Governing is about delivery. The challenge of government is to improve the quality of life of citizens. “Are you better off today than you were four years ago?” has been a recurrent refrain in quadrennial American presidential campaigns and is a question that is just as relevant in the African political context. To meet this challenge, a government has to come up with a clear and coherent set of ideas—a vision—and use available resources and instruments as efficiently as possible to produce the results that citizens expect. The risk taking involved in articulating and defining a progressive vision for the future is what defines great leadership. Achieving that vision as effectively as possible requires effective risk management—in other words, good governance. Read More:

SOURCE: Mohamed Ibrahim of Mo Ibrahim Foundation

Out of Date

The stock market works like this: buy or sell, buy or sell, buy or sell, buy or sell, buy or sell, buy or sell, buy or sell. You make a purchase based on the future from a trend analysis. Will the federal funds rate rise or fall? What factors will influence this decision? You need accurate data. The best data money can buy.

Nothing and I mean nothing, in the world moves forward without raw, predictable data. Anything you purchase, sell, or own must have a value.

And data determines that value, now and in the future. There can be no guarantee of a predictable outcome without that information. If you live in a glasshouse, you better hope it does not rain rocks.

We must trust the data will lead us to a predictable outcome. However, if the data is incorrect or outdated, everything can go wrong.

That explains why over 130 nation’s education systems are failing, and millions of lives are wrecked year in year out. Blame it on bad data.

The Stock Market Crash of 1929

The financial outcome of the crash was devastating. Between September 1 and November 30, 1929, the stock market lost over one-half its value, dropping from $64 billion to approximately $30 billion. Any effort to stem the tide was, as one historian noted, tantamount to bailing Niagara Falls with a bucket. The crash affected many more than the relatively few Americans who invested in the stock market. While only 10 percent of households had investments, over 90 percent of all banks had invested in the stock market. Many banks failed due to their dwindling cash reserves. This was in part due to the Federal Reserve lowering the limits of cash reserves that banks were traditionally required to hold in their vaults, as well as the fact that many banks invested in the stock market themselves. Eventually, thousands of banks closed their doors after losing all of their assets, leaving their customers penniless. While a few savvy investors got out at the right time and eventually made fortunes buying up discarded stock, those success stories were rare. Housewives who speculated with grocery money, bookkeepers who embezzled company funds hoping to strike it rich and pay the funds back before getting caught, and bankers who used customer deposits to follow speculative trends all lost. While the stock market crash was the trigger, the lack of appropriate economic and banking safeguards, along with a public psyche that pursued wealth and prosperity at all costs, allowed this event to spiral downward into a depression. Read More:

Source: OpenStaxCollege

A Right Way and a Wrong Way

The World Top 20 Project is our solution to solving the data crisis. The project’s goal is to locate, update, and monitor over 200 countries’ educational systems from early childhood to college graduation in 2030. By creating and building a new open-source international database for UN nations.

The World Top 20 Project is part of the UN’s second global movement (The Sustainable Development Goals – SDG) to strengthen human rights, environmental conditions, and economic development in developing countries.

What are the Sustainable Development Goals?

The Sustainable Development Goals (SDGs), also known as the Global Goals, were adopted by all United Nations Member States in 2015 as a universal call to action to end poverty, protect the planet and ensure that all people enjoy peace and prosperity by 2030.

The 17 SDGs are integrated—that is, they recognize that action in one area will affect outcomes in others, and that development must balance social, economic and environmental sustainability. Read More:

Source: United Nations Development Programme

The World Top 20 Project was created and designed by NJ MED. An American non-governmental organization that offers market analysis and creative programming design services to local, national, and international educational organizations from early childhood to post-secondary education.

To create the new international education database, the Project works with a volunteer network of high school and college students, their parents, teachers, and educators to collect data from communities, schools, and universities. This database sets five educational goals for each country to follow by 2030 to meet the UN’s SDG education objective of Ensure inclusive and equitable quality education and promote lifelong learning opportunities for all.

New Sway Style – How we plan to get it done using our approach

Unlike current educational data collection structures, the World Top 20 Project’s volunteer network raises awareness of current educational levels first. It draws attention to the fact that the data is three, four, or five years old, or that no data is usable.

Second, the network seeks to collect information from local schools, school districts, local health agencies, and social service providers. To find the number of school-age children in school or out.

The World Top 20 Project then compiles data from each area of their country, which is then processed into a national database system to determine where gaps in their country’s education system exist.

The World Top 20 Project uses this data and produces three global education competitions to assess each nation’s progress in order to make the data more relevant and give it life.

  1. The Global Academic Awards (GAA)
  2. The World Education Championship (WEC)
  3. The International Tournament of Education Excellence (ITEE)

Each competition uses the data to compare countries, within their continent, then to the levels of other countries across the world.

The third and final step is to use the data to improve their country’s education system and achieve their 2030 objectives. The aim would be to create and expand programs and services in order to:

  • design policy campaigns to reduce gender inequality
  • organize community educational events and parenting programs
  • coordinate fund-raisers to help provide school supplies for students
  • develop new workbooks for teachers
  • increase school breakfast and lunch nutrition programs
  • expand school health care programs for female students
  • link businesses with schools
  • work on improving school infrastructure (clean water and Internet access)
  • set-up community after-school programs with universities
  • create more recreational programs that teach social values

We believe this strategy will impact the world and give hope to the hopeless and raise the status of education data collection.

No more guess work, just fact works.

Join Us

As we can see without accurate or up to date information, problems won’t go away. They will waste money, time and energy. There is no replacement for accurate data.

Either we fix the data problem or watch lives continue to drain away.

Its are choice.

What is the World Top 20 Project?

0

What is the World Top 20 Project?

Nearly one billion people will not be able to read this article by the year 2030. WHY?

How did we get here? Something from nothing that is how the world began. So what is next?

Things started growing, evolving, movement leading to more movement. Things begin to happen. Moments turn into action, actions started to get reactions, a need for organizing and placing things in order. So starting to build became a need to protect and survive. Life became man, and man became life.

For centuries things continue to change, evolve into something new. To the point, the man wanted to walk on the moon. With all that, the need to evolve, man could do nothing if he or she could not communicate with one another.

We have entered the 21st century, things are still, involving, Yet mankind has not yet, reached its full potential. That is because over 700 million people cannot keep up with the ever-changing world.

700 Million will turn into over one billion by 2030 if we do not take a breath and think about one billion people. That is a lot of people. That is a lot of weight that is holding down progress. That is slowing down, dragging down mankind.

We have to fix this problem. Either we accept this challenge or wait for whatever comes next.

Mankind its Own Worst Enemy

Our organization, NJ MED, wants to help. We joined the UN’s Sustainable Development Goals Initiative to share our knowledge of how to overcome barriers and obstacles in educating at-risk communities.

Despite the fact that we are headquartered in the United States, we have turned around the most difficult-to-reach groups in America’s poorest and most violent city. As a result, the notion that nothing can be achieved has become second nature.

We asked the UN what the most difficult aspect of achieving their educational objective of “ensuring inclusive and equitable quality education and promoting lifelong learning opportunities for all” was.

According to the United Nations, about 260 million children do not have access to education. After the age of 11, another 400 million students, mainly girls, drop out.

We asked the most important question to examine the problem based on our experience: where is the data? Where are you getting these figures from if you don’t have reliable or at least valid up-to-date data? The number one issue we discovered was inadequate recordkeeping by local schools and school districts.

According to the United Nations, each country keeps its own records. As a result, we began collecting data from over 200 countries and discovered that only 63 countries had data that was up to date within two-years. Data from another 30 to 40 countries is four to five years old. The remaining countries have data ranging from ten years old to none at all.

So this is where we started looking for a solution to the problem. “We cannot solve our problems with the same thinking we used when we created them,” Albert Einstein said. Factors shift, and we need to be aware of them. This is where we must start.

Building Together

As a result, we must locate correct data. Our organization has been publishing quarterly and annual rankings of the nation’s education systems for the past seven years. Our most important job has been convincing the countries Department of Education to cooperate with us. But to no avail!

Therefore, we must depend on data from six different international organizations: The Organisation for Economic Co-operation and Development (OECD), Programme for International Student Assessment (PISA), the United Nation’s Economic and Social Council (UNESOC), The Economist Intelligence Unit (EIU), the Trends in International Mathematics and Science Study (TIMSS) and Progress in International Reading Study (PIRLS). Then, to ensure that the data is correct, we submit it to each country’s Ministry of Education Department.

Once again, no reply! If we want to help the United Nations in achieving their Sustainable Development Goals, we must take a different approach.

This dynamic approach is the World Top 20 Project. Whose goal is to form a National Team of students, teachers, parents, and educators to help us in collecting data on education in their country.

Create Interest – National Teams

Albert Mitchell II, the CEO/Founder of NJ MED, has over 35 years of experience in global sports marketing. Working with the media and national leaders to bring the World Cup to America in 1994 is one example. He is aware of the enthusiasm and emotional commitment that countries make in their national pride through sports.

So, in 2018, NJ MED launched the World Top 20 Project in an attempt to transfer the nation’s enthusiasm and emotional commitment to their sports teams to their children and communities. It appears to be easy, but it is hard to do.

You must have something to benefit or accomplish to make a National Team represent your country. As a result, the World Top 20 Project will focus on five educational levels for students aged three to twenty-three. From early childhood enrollments to primary and secondary school completion rates to high school and college graduation rates.

The World Top 20 Project will develop five educational goals for each educational level for 2030 to generate interest. These objectives focus on current achievement levels, the country’s economic and social conditions, and the youth population.

As a result, each country’s national team now has a target of achieving those five educational goals by 2030.

I See Where this is Going

Starting this year, we will challenge every country on the planet to present their most recent data for all five levels in education. The Global Academic Awards (GAA) is an international competition.

Countries from all over the world will be matched in this competition. First, they will compete from their intercontinental geographical areas. After that, it’s on to the continent stage. Africa, Asia, Central America, North America, South America, Europe, the Caribbean, and Oceania are among them.

The winners of each continent will progress to the global rounds. The country with the highest cumulative score advances to the medal rounds. The gold medal is awarded to the nation with the highest overall score. A silver medal is awarded to the second-highest score. The bronze medals will go to the two countries with the third-highest ratings.

The tournament will be held concurrently with the World Olympic Games. Next year, we will host a second international educational competition, The World Education Championship (WEC), which will be held in conjunction with the FIFA World Cup. The following year, in addition to the FIFA Women’s World Cup games, we will host our third international competition, The International Tournament of Education Excellence (ITEE).

With all eyes on the sporting world, we will challenge countries, leaders, and people to think about their children’s futures, as well.

Build it, and they will Come

It’s difficult to attract an audience for something you can’t see, hear, or attend. It would be perfect if we could get just one person, rather than an entire country, excited or interested. It’ll take a lot of persuasion. That is why we need everyone to stand behind the flag.

Every One Behind the Flag is one of the World Top 20 Project’s three promotional campaigns. The foundation of this campaign is gaining support from schools, universities, corporations, non-governmental organizations, and the media. By emphasizing the importance of helping in the improvement of educational quality for our children and future leaders of the nation.

We will urge local communities and national governments to collect the data needed to track the progress of the nation’s education system if this campaign will succeed. This information will be used in the three international competitions to mobilize people.

The World Top 20 Project’s second campaign, Futbol and Books, will help collect data twice a year to ensure that data is collected from all parts of the country. The number of children in school from Early Childhood to Lower Secondary will be included in the data they gather in the spring. The number of children who are not attending school will be included in the data gathered in the fall.

Adopt a Country is the name of the third campaign. This campaign will focus on collaborating with universities and colleges in their country to track the number of high schools and college students. As well as the number of students who graduated the previous year.

As you can see, the World Top 20 Project aims to promote inclusion and ensure that each nation is responsible for educating children from all parts of the world.

Reality versus Perception

The goal of saving and educating one billion people may not be attainable. It becomes more of a perception if we know it can happen.

Our commitment is to plan for the transformation of our perception into a belief that it will become a reality. To think that things will start to grow, evolve, and move in a direction that leads to more movement. Things will begin to fall into place. Moments turn into actions, and actions begin to elicit responses, forcing the need to organize and place things in their proper places. As a result, beginning to rebuild becomes a duty to secure and thrive.

The World Top 20 Project helps to end illiteracy worldwide. But, in order for this to occur, we must reduce gender inequality and eliminate poverty in communities.

Only if we can communicate with one another could this be possible. Working together to educate one another and having faith in one another.

A Smarter World is our philosophy. A Greater World. Become a part of this world with us. Join the World Top 20 Project.

A Smarter World. A Greater World: The World Top 20 Project

0

A Smarter World. A Greater World: The World Top 20 Project

NJ MED says they can end global illiteracy by 2030

NJ MED believes they can save the world and make everybody in it smarter. By ending global illiteracy. Let’s see how they plan to accomplish this task.

We sat down with NJ MED’s CEO/ Founder, Mr. Albert Mitchell II, last January before the pandemic and asked him “Why do you think a small organization like yours can eliminate the impossible task of global illiteracy?

He said, “Illiteracy is a condition, not a disability. If we can provide the tools to improve the condition, then we can solve the problem.” Our only obstacle is our ability to think we cannot accomplish the impossible. Since we started NJ MED, we sought out the impossible and try to bend it to our will.”

We asked him, “What are the fundamental planks of your platform? He sat back in his chair, rocking, and said it with a cool and assured reply, ‘It’s not up to us. It’s up to the people that it effects. We cannot change what that does not want to change. We can only suggest what is there.”

Will, what does that mean?

“It means things around here do not look so good are you happy about that? Do you want to find a better way to live? It’s up to you.”

So it is a choice you tell them is the problem?

No, it’s a lack of wanting too. You want this, you want that, but if you do nothing, but want and want, and do nothing about it. That is what you get, nothing.

He said, “Winners go for it. They test their limits. They fight their fears and doubts and become what they want, what they need to have! So our message or platform is to wake up, team up and build power. Become a force, be energized. Make the impossible possible you can live with that.’

That sounds good in theory, but how do I a powerless person build up that much power to force change?

Mr. Mitchell said, “You need help. You need to find and work with people that have those resources to pull you forward. That is why we created the World Top 20 Project.

What is the World Top 20 Project?

He told me the project is broken down into three parts. All set-up to link with organizations and governments that are participating in the United Nation’s Sustainable Development Goals Initiative.

The purpose of this initiative is to ask countries to achieve 17 economic and social improvement goals by the year 2030. (Here is a link to those targeted goals and the indicators to measure their success).

Mr. Mitchell said their efforts and the World Top 20 Project focus is on Goal number four mission to “Ensure inclusive and equitable quality education and promote lifelong learning opportunities for all”.

He said, he spoke with UN Officials and asked them their biggest problem to achieving this target goal. They said there were over 260 million children out of school around the world and some 750 million adults already illiterate, and two-thirds of these are women. If nothing is done by 2030, many countries in Africa and Asia will face severe poverty and death. Because they are not able to create a workforce to sustain a family or economic development growth.

Mr. Mitchell said he asked where the data they were referencing this information from. The UN response was, each country keeps its data and shares it with the international body. However, most African and Asian country data is unavailable or has not been updated for some time.

Mr. Mitchell said he asked them if this was true, how do you know the size of the problem. He said the UN response was most of these figures are estimates. That’s when, he said, that is your biggest problem. You do not have accurate data. So there would be no way to measure how successful you are if you do not have a real established reference point.

That’s when, he proposed developing a project that can measure the real size of the problem, how to track progress annually, and measure the outcome of each target goal. Thus, NJ MED launched the World Top 20 Project to answer those questions.

The World Top Project’s 3 Stages are below:

  1. Create an Open Database to rank nations education systems
  2. Find Missing Education Data from each country
  3. Process and monitor the data annually until 2030

Global Education Movement – 5 National Education Goals

After listening to Mr. Mitchell talk about why they created a project to address the world illiteracy problem. We wanted more details on how it works. Here are the questions. We had, and here are his answers to those questions.

The first questions put to him were on general policy matters.

In your opinion, what is the method by which there is a disparity in a continent like Africa and Asia in education?

Political leadership: Most African nations rely on selling their goods. Not producing an economy to be self-sufficient. Because of poor trade agreements with the western continents, they are operating on the next deal mentality. Not building but keeping themselves in power is their focus.

Countries in Asia, however, the successful ones, practice and operate within a stable government. Their leadership and trade agreements are strong which ensures they can build an education system to continue their growth.

So how do you plan to close such a leadership gap for nations in Africa?

Ego: We want nations in Africa and around the world to prove themselves. We want them to feel they can accomplish anything if they work together. That is why we set goals for each nation to achieve by 2030.

What type of goals, and how did you set these goals?

He said, “Goals, which benefit everyone! From the largest cities to the smallest village, these are goals you can feel and touch. It is up to the leadership of the people to accomplish them. Plus, it’s a unifying approach to support each other, cheering for everyone to do their best.

The goals we set for each country. Where based on their current education data, their economic strengths, and their social environments. We then looked at their youth population size and projected how close they could come to accomplish the goals based on the three other variables.

Have any government agreed to your goals?

Not with us, but with United Nations SDG Initiative. If you look at the root of most of those Goals in the SDG, without a strong education system most of them will not be sustainable.

How has joined your project?

We have students, parents, teachers, educators, and other NGOs in 147 countries forming volunteer National Teams to bring awareness to their nation’s five education goals for 2030.

To do actually what?

Create National pride for their country. If you look at it, it does the same thing sports national teams do. They represent their country to try to bring happiness and accomplishment to its people. Our approach is the same but more meaningful. It helps everybody become better people.

Who is funding this project?

That is a local matter. We have support from the Google AD grant program and Pro Bono organizations working with us to organize the project. However, at the local levels, each national team will conduct its fundraising operations.

What type of organizational support is your NJ MED providing?

We have created a Facebook Group to help set-up National Teams. We provide weekly group assignments to build their message and set-up programs to help them get education data not available to the UN and other education institutions.

Getting Results

We then asked him how will you measure the success of his project. Will it be based on meeting SDG 4 target goals or countries reaching the five educational goals your project set.

How can we measure the success of your project?

Our project goals are the same as the UN. We want to improve the quality of education for students around the world. Our five goals address that.

We, however, feel it is vital that the stakeholders play a part. These stakeholders are student’s parents, teachers, and college students looking for answers to their future. Schools and universities will be responsible for providing education improvement, which will require school leaders and government support to invest more resources.

So our project success will be judged if we can bring all these stakeholders together to reach their educational goals by 2030.

You mentioned your project wants to improve five educational levels. How does that address the global illiteracy issue it seems the UN SDG 4 wants to focus on?

It helps to know your alphabet and how to count went you enter formal schooling. Therefore, it’s crucial to manage these skills to speed up your learning by the age of 5.

The points of making sure all children between the ages of 6 to 12 have access to a structured environment to process developmental skills. Sets a long term effect on their ability to become a productive adult.

As children reach the teen years of 14 to 18, social norms are developed that encourage them to use better decision-making skills as they enter adulthood. If they choose to advance those skills. Through higher education society benefits from a more well-rounded adult.

Therefore, our goals need for students to function literate at all five stages, and again none of this can be achieved if the stakeholders do not work together.

How can you make sure these stakeholders can or will work together?

Ah, it’s a project. We hope our approach works. Our theory is sound. The expected desire outcome for all participants is fulfillment and success.

So what makes you so sure it will work?

Again it is based on you. Do you want to be successful? Do you want your success to last forever? You can have this if this happens. Join us to make it happen.

Make what happen?

Build a self-conscious world of respect for yourself and your fellow man, a world where everyone is striving to be their best. Everyone living in a positive mindset.

How are you going to make this happen?

With three International Campaigns, one focus on patriotism – Everyone Behind the Flag, to accomplish the five educational goals for 2030. The second – Futbol and Books, to eliminate child illiteracy, working with the world’s largest sports community football (soccer). The third campaign – Adopt A Country, works with universities that are participating in the UN SDG to help process the Project’s database of nations.

It sounds like you put a lot of thought into this?

We have, and it is all ready to go.

How can someone find out more about your project and join if they want to help?

They can join their countries National Team by signing up at the project’s Facebook Group. Then starts posting their nation’s educational goals for 2030 on their social media accounts and participate with their National Team in seven international competitions representing their country.

Mr. Mitchell, we would like to thank you for your time and wish you great success with your project?

Thank you for helping us share our message with the world.

Interview conducted by Neely Fuller, a freelance writer for Medium, Vocal, and NJ MED

Educational Goals

0

World Top 20 Project’s Education Rankings: Breaks Down 2020


In a year where the world changed, a new country climbed atop the education landscape. While in the classroom, where the action counts. Getting students into them was the biggest challenge in 2020.

Countries that lack the 21st century technology infrastructure were doomed at the start. In continents like Africa, where 80 percent of the children had no access to the Internet, to 69% in Asia, face the cold reality they are second-class citizens.

The World Top 20 Project lives in reality and accepts one-fifth of children have no access to schools. Not happy about the situation, the project knows four is larger than one. So, finding a solution to improve the quality of the lives of all children that do have, has brought new concerns.

As usual, the World Top 20 Projects annual Education Rankings list over 200 nations’ strengths and weaknesses, and shows how it affects the economic and social conditions of countries.

What makes the Education Rankings unique is the goal. That goal has brought a challenge to every nation to achieve five educational goals by 2030.

From Early childhood enrollment rates for 3 to 5-year-old. To oversee children 6 to 11 complete Primary education. To achieve the United Nations Sustainable Development Goals 4 missions for 12 to 14-year-old children to attend and complete lower secondary education levels.

The Project rankings also focus on fifteen to eighteen-year girls and boys completing twelve years of schooling to help to prepare them for early adulthood. With the advanced, level of higher education in achieving a College Graduation degree at the top level of education.

Our mission is to bring order and support to every child, no manner where they live.

Below you will find more information about the World Top 20 Project 2020 Education Rankings.

Database Tiers Process

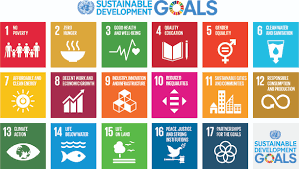
Tiers breaks down the countries in the World Top 20 Project educational database rankings. The rankings are used to support the United Nations Sustainable Development Goals (SDG) 2030 Initiative.

The focus is to help nations achieve the SDG 4 education mission – to ensure inclusive and equitable quality education and promote lifelong learning opportunities for all.

SDG 4 has ten target areas and 11 indicators to measure its success. To help keep this simple, the World Top 20 Project sets five educational goals for each nation to reach by 2030, which will help them capture all ten targets and match all 11 indicators.

Tier 1: Focus on the top 20 nation’s progress and digression in improving education in their country. It also looks at how this is affecting their economic growth and impacts their social conditions.

The Top 20 Countries Ranked in 2020 are:

1. Denmark– Last Year Rank: 3 – Becomes the second country ranked number one in the World Top 20 Project international database. Denmark captures this year’s spot by being one of the most progressive countries attacking the COVID 19 pandemic. While other countries panicked, Denmark leaders decided to take a more measured approach to protect their school staff and provide education services to their students.
Progress: Early Childhood Enrollment Rate; Digress: High School Graduation Rate, Strengths: Adult Illiteracy Levels, Weaknesses: Access to the Internet

2. Netherlands-Last Year Rank: 28 – This was a shocker, the Netherlands rose 26 spots to become number two. Similar to Denmark, the Netherlands school leadership made it possible for students to attend school with little disruption.
Progress: School Safe Levels; Digress: NI,
Strengths: Adult Illiteracy Levels, Weaknesses: Poverty Level

3. Germany– Last Year Rank: 23 – Germany ranks number three. Not to say their education system is lacking, but to rise 20 spots from last year is eye-opening. As the two countries rated above them, their governments were aggressive in addressing the pandemic. Making sure their country suffers as little as possible in the world crisis.
Progress: Students to Teacher Ratio; Digress: Secondary School Completion Rate, Strengths: Adult Illiteracy Levels, Weaknesses: Poverty Level

4. Ireland– Last Year Rank: 20 – Moves into the top 10 education ranking. Ireland is a country that is, overshadow by the rest of the world, yet in education, they remain one of the best.
Progress: Early Childhood Enrollment Rate; Digress: High School Graduation Rate, Strengths: Crime Rate; Weaknesses: Poverty Level

5. Sweden– Last Year Rank: 7 – Sweden remains in the top 10 and moves into the top five. Every year Sweden proves to have one of the world’s best education systems.
Progress: Students to Teacher Ratio; Digress: High School Graduation Rate,
Strengths: Adult Illiteracy Levels, Weaknesses: Poverty Level

6. Finland– Last Year Rank: 1 – Finland falls to number six. After being ranked the best for the first two years of the World Top 20 Project education rankings. Always classified as the perfect model in education, they may need a reboot in 2021.
Progress: Students to Teacher Ratio; Digress: Early Childhood Enrollment Rate;
Strengths: Poverty Level, Weaknesses: Unemployment Rate

7. South Korea– Last Year Rank: 2 – In a year went anything could go wrong, South Korea education system ranking dropped five spots. This may be a small setback for a big comeback.
Progress: High School Graduation Rate; Digress: Free Schools,
Strengths: Crime Rate, Weaknesses: Poverty Levels

8. Slovenia– Last Year Rank: 10 – Remains a top 10 nation in education, according to the World Top 20 Project rankings. Slovenia is one of those sleeper countries that appears out of nowhere, but if you check the data, they belong.
Progress: High School Graduation Rate; Digress: Out of School Children,
Strengths: Adult Illiteracy Levels, Weaknesses: National Debt

9. France– Last Year Rank: 24 – France is another surprise member of the World Top 20 Project education rankings. France has a very high-level of immigrants to educate. So no one expects them to rank as one of the best countries in educating their population. They have found a way to get the job done. Well done.
Progress: Early Childhood Enrollment Rate; Digress: Academic Levels – Test Scores, Strengths: Adult Illiteracy Levels, Weaknesses: National Debt

10. Belgium– Last Year Rank: 21 – Belgium is another country that handled the COVID 19 crisis with strong government leadership. Moving up 11 places to make the top 10.
Progress: Early Childhood Enrollment Rate; Digress: High School Graduation Rate, Strengths: Adult Illiteracy Levels, Weaknesses: National Debt

11. Australia– Last Year Rank: 27 – Australia climbs into the World Top 20 Project rankings to number 11. Australia is a progressive country, always looking for ways to improve its status in the world. It seems they have a plan, and it is working – Improve education in their country. SDG 4 approved.
Progress: Academic Levels – Test Scores; Digress: Students to Teacher Ratio,
Strengths: Adult Illiteracy Levels, Weaknesses: Poverty Level

12. Iceland– Last Year Rank: 30 – Iceland moved from number 30 to number 12 in this year’s education rankings. Like their Scandinavian brothers, they were able to provide education services to their students. As many countries struggled to do in 2020.
Progress: Students to Teacher Ratio; Digress: NI,
Strengths: Poverty Levels, Weaknesses: National Debt

13. Japan– Last Year Rank: 13 – Japan one of Asia’s most powerful countries remains as number 13 in the World Top 20 Project education rankings. Japan is viewed as one of the world’s powerhouse in the World Top 20 Project. To achieve all its targeted five-education goals for 2030.
Progress: High School Graduation Rate; Digress: Students to Teacher Ratio,
Strengths: Crime Rate, Weaknesses: National Debt

14. United Kingdom– Last Year Rank 5 – The UK fell nine places in this year’s ranking. While in other international education ranking polls, they are picked number one. Ridiculous!
Progress: Early Childhood Enrollment Rate; Digress: Students to Teacher Ratio,
Strengths: Adult Illiteracy Levels, Weaknesses: Poverty Level

15. Norway– Last Year Rank: 9 – Norway falls out of the top 10 this year. A little surprising, since they do well in all areas of education. This was a strange year, and this ranking is too.
Progress: Early Childhood Enrollment Rate; Digress: NI,
Strengths: Adult Illiteracy Levels, Weaknesses: NI

16. Canada– Last Year Rank: 32 – Canada is another country that withstood COVID 19 and delivered services to its students. The only drawback to the Canadian education system is missing international data to accurately establish their status as one of the best.
Progress: Academic Levels – Test Scores; Digress: NI,
Strengths: Adult Illiteracy Levels, Weaknesses: National Debit

17. Spain– Last Year Rank: 18 – Spain falls one spot from last year’s rankings. With all the divide in the country between Spain and Catalonia, they remain together in improving education and are jointly committed to achieving the UN’s SDG 4 objectives.
Progress: Early Childhood Enrollment Rate; Digress: High School Graduation Rate, Strengths: Adult Illiteracy Levels, Weaknesses: National Debt

18. Israel– Last Year Rank: 6 – Israel fell out of the top 10 for the first time this year. COVID 19 affected them as it did to so many other countries. Israel will try to bounce back in 2021 and return to the top half of the World’s Top 20 rankings.
Progress: Early Childhood Enrollment Rate; Digress: Academic Levels – Test Scores, Strengths: NI, Weaknesses: Poverty Level

19. Russia– Last Year Rank: 12– Just like everyone else, Russia took a hit from COVID 19. As it disrupted economics and caused mass confusion, countries were put to the test. Russia has always landed on its feet and remained as one of the world’s best-educated countries in 2020.
Progress: High School Graduation Rate; Digress: Students to Teacher Ratio,
Strengths: National Debt, Weaknesses: Crime Rate

20. Poland– Last Year Rank: 14 – Poland continues to shine in quest of achieving SDG 4 educational standards. Finishing a little lower than last year, Poland remains a strong and focused country in the new 21st – century knowledge-based marketplace.
Progress: Students to Teacher Ratio; Digress: Academic Levels – Test Scores,
Strengths: Adult Illiteracy Levels, Weaknesses: Poverty Level

*NI= No Information

Areas of Strengths and Weaknesses in Education

Tier 2: Ranks countries 21 through 40, whose progress is tracked from last year. The key areas of interest were, their strengthen indicators, and where they need to improve education standards.

Most countries strength where their students to teacher ratio. The area most struggled with was early childhood education. Showing more government spending on education was used to improve technology in schools.

21. Hong KongProgress: College Graduation Rate; Digress: Early Childhood Enrollment Rate, 22. SingaporeProgress: Academic Levels -Test Scores; Digress: Early Childhood Enrollment Rate, 23. PortugalProgress: Students to Teacher Ratio; Digress: High School Graduation Rate, 24. LithuaniaProgress: Students to Teacher Ratio; Digress: Early Childhood Enrollment Rate, 25. EstoniaProgress: High School Graduation Rate; Digress: Academic Levels -Test Scores, 26. New ZealandProgress: Early Childhood Enrollment Rate; Digress: NI, 27. SwitzerlandProgress: Students to Teacher Ratio; Digress: Early Childhood Enrollment Rate, 28. HungaryProgress: Students to Teacher Ratio; Digress: College Graduation Rate, 29. United StatesProgress: Free Schools; Digress: Early Childhood Enrollment Rate, 30.TaiwanProgress: Academic Levels – Test Scores; Digress: NI, 31. LatviaProgress: Students to Teacher Ratio; Digress: Academic Levels – Test Scores, 32. GreeceProgress: Students to Teacher Ratio; Digress: Academic Levels – Test Scores, 33. Czech RepublicProgress: Early Childhood Enrollment Rate; Digress: High School Graduation Rate, 34. AustriaProgress: Students to Teacher Ratio; Digress: Academic Levels – Test Scores, 35. ItalyProgress: High School Graduation Rate; Digress: Academic Levels – Test Scores, 36. ChinaProgress: Early Childhood Enrollment Rate; Digress: Academic Levels – Test Scores, 37. TurkeyProgress: NI; Digress: Early Childhood Enrollment Rate, 38. ArgentinaProgress: Primary School Completion Rate; Digress: Academic Levels – Test Scores, 39. MexicoProgress: Primary School Completion Rate; Digress: Students to Teacher Ratio, 40. ChileProgress: Early Childhood Enrollment Rate; Digress: Academic Levels – Test Scores

Tier 3: Focuses on countries ranked 41 to 60. A lack of education data was available from most of these countries. Which shows a poor communication structure of governments to their local levels. From the countries, we were able to find data. A majority of them have developed a good student to teacher ratio. Indicating a desire to improve education for their country and students, but a large disconnect from school leadership for creating a self-sufficient education system.

41. SlovakiaProgress: Students to Teacher Ratio; Digress: High School Graduation Rate, 42. LuxembourgProgress: Students to Teacher Ratio; Digress: Academic Levels – Test Scores, 43. KazakhstanProgress: High School Graduation Rate; Digress: Early Childhood Enrollment Rate, 44. Costa Rica-Progress: Students to Teacher Ratio; Digress: High School Graduation Rate, 44. Saudi ArabiaProgress: Students to Teacher Ratio; Digress: Early Childhood Enrollment Rate, 46. GrenadaProgress: Students to Teacher Ratio; Digress: NI, 47. BruneiProgress: Students to Teacher Ratio; Digress: NI, 48. San MarinoProgress: NI; Digress: NI, 49. FijiProgress: NI; Digress: NI, 50. SamoaProgress: NI; Digress: NI, 51. SeychellesProgress: Students to Teacher Ratio; Digress: NI, 52. MongoliaProgress: NI; Digress: NI, 53. VietnamProgress: Primary School Completion Rate; Digress: NI, 54. EcuadorProgress: Secondary School Completion Rate; Digress: Students to Teacher Ratio, 55. MaltaProgress: Students to Teacher Ratio; Digress: Early Childhood Enrollment Rate, 56. NepalProgress: Primary School Completion Rate; Digress: Students to Teacher Ratio, 57. BelarusProgress: Students to Teacher Ratio; Digress: NI, 58. OmanProgress: Secondary School Completion Rate; Digress: NI, 59. Saint Kitts and NevisProgress: Secondary School Completion Rate; Digress: NI, 60. MaldivesProgress: Students to Teacher Ratio; Digress: NI

Tier 4: Shows the results from countries ranked 61 to 80. Here a lack of education data available means the government again is failing their students. Without, data, much-needed data, to plan growth or investment, these countries’ economic and social development is doomed to fail. The poor relationship between these government leaders in education is the main reason for their problems.

61. Sri LankaProgress: Primary School Completion Rate; Digress: NI, 62. Macau (PRC)Progress: Students to Teacher Ratio; Digress: Academic Levels – Test Scores, 63. UzbekistanProgress: Students to Teacher Ratio; Digress: NI, 64. KyrgyzstanProgress: Primary School Completion Rate; Digress: Early Childhood Enrollment Rate, 65. Saint Vincent and the GrenadinesProgress: Secondary School Completion Rate; Digress: NI, 66. AlbaniaProgress: Students to Teacher Ratio; Digress: NI, 67. IndonesiaProgress: Students to Teacher Ratio; Digress: High School Graduation Rate, 68. SerbiaProgress: Students to Teacher Ratio; Digress: NI, 69. Timor-LesteProgress: Primary School Completion Rate; Digress: NI, 70. GeorgiaProgress: Secondary School Completion Rate; Digress: NI, 71. PhilippinesProgress: NI; Digress: NI, 72. KiribatiProgress: Secondary School Completion Rate; Digress: NI, 73. AlgeriaProgress: Primary School Completion Rate; Digress: NI, 74. ColombiaProgress: Primary School Completion Rate; Digress: NI, 75. Antigua and BarbudaProgress: NI; Digress: NI, 76. CroatiaProgress: Early Childhood Enrollment Rate; Digress: NI, 77. PeruProgress: Students to Teacher Ratio; Digress: NI, 78. MauritiusProgress: Primary School Completion Rate; Digress: NI, 79. GibraltarProgress: NI; Digress: NI, 80. MontenegroProgress: NI; Digress: NI

Tier 5: Represent countries ranked 81 through 100. Points to countries where investment in education sets to limit the growth potential of its people. More teachers are needed; more schools need to be modernized. Life has to be put back into communities and villages. This is where the United Nations SDG 4 mission will be tested the most.

81. IranProgress: Primary School Completion Rate; Digress: NI, 82. BahrainProgress: Students to Teacher Ratio; Digress: Secondary School Completion Rate, 83. LiechtensteinProgress: Students to Teacher Ratio; Digress: NI, 84. EgyptProgress: NI; Digress: Students to Teacher Ratio, 85. BelizeProgress: Primary School Completion Rate; Digress: NI, 86. AzerbaijanProgress: Primary School Completion Rate; Digress: NI, 87. TajikistanProgress: Secondary School Completion Rate; Digress: NI, 88. BhutanProgress: Primary School Completion Rate; Digress: Students to Teacher Ratio, 89. Malaysia– Progress: Primary School Completion Rate; Digress: NI, 90. KenyaProgress: Primary School Completion Rate; Digress: Students to Teacher Ratio, 91. QatarProgress: Students to Teacher Ratio; Digress: NI, 92. NauruProgress: Secondary School Completion Rate: Digress: Students to Teacher Ratio, 93. KuwaitProgress: NI; Digress: NI, 94. DominicaProgress: Students to Teacher Ratio; Digress: NI, 95. BoliviaProgress: Secondary School Completion Rate; Digress: NI, 96. Dominican RepublicProgress: NI; Digress: High School Graduation Rate, 97. Saint LuciaProgress: Students to Teacher Ratio; Digress: NI, 98. ArmeniaProgress: NI; Digress: NI, 99. RomaniaProgress: Students to Teacher Ratio; Digress: NI, 100. British Virgin Islands (UK)Progress: NI; Digress: NI

Economic and Social Impact of Education


Tier 6 through Tier 10 will explore the strengths and weaknesses of countries ranked below 100. Countries ranked 101 to 120 results are below.

Tier 6: You can see most of these countries’ weaknesses stems from the social condition of adult illiteracy. The strengths are generated from a low–wage labor force. That demonstrates the lack of education is affecting both the economic and social growth of the population.

101. IndiaStrengths: Unemployment Rate; Weaknesses: Adult Illiteracy Levels, 102. LaosStrengths: Unemployment Rate; Weaknesses: Adult Illiteracy Levels, 103. UruguayStrengths: Adult Illiteracy Levels; Weaknesses: Access to Internet, 104. TunisiaStrengths: Access to Electricity; Weaknesses: Adult Illiteracy Levels, 105. EswatiniStrengths: National Debt; Weaknesses: Unemployment Rate, 106. GhanaStrengths: Work Force Participation; Weaknesses: Adult Illiteracy Levels, 107. ThailandStrengths: Unemployment Rate; Weaknesses: Access to Internet, 108. MoldovaStrengths: Adult Illiteracy Levels; Weaknesses: Poverty Level, 109. Burma (Myanmar)Strengths: Work Force Participation; Weaknesses: Adult Illiteracy Levels,110. North KoreaStrengths: NI; Weaknesses: NI, 111. VenezuelaStrengths: National Debt; Weaknesses: Crime Rate, 112. El SalvadorStrengths: Access to Electricity; Weaknesses: Crime Rate, 113. MoroccoStrengths: Crime Rate; Weaknesses: Adult Illiteracy Levels, 114. South AfricaStrengths: Access to Electricity; Weaknesses: Crime Rate, 115. Jamaica– Strengths: Access to Electricity; Weaknesses: National Debt, 116. PanamaStrengths: Unemployment Rate; Weaknesses: Poverty Level, 117. Solomon IslandsStrengths: NI; Weaknesses: NI, 118. Cape VerdeStrengths: Access to Electricity; Weaknesses: National Debt, 119. Sao Tome and PrincipeStrengths: NI; Weaknesses: Adult Illiteracy Levels, 120. CambodiaStrengths: Work Force Participation; Weaknesses: Adult Illiteracy Levels

Tier 7: Ranks countries 121 to 140, shows the strengths of these countries are in workforce development, but, again offering low wage-paying jobs. The next strengths indicator is a low National Debt, which signifies these nations have poor trade agreements.

It may be because most of these countries’ weaknesses are in adult literacy, which points to lower-skilled jobs and early entry into the workforce. Again demonstrating the lack of a high quality education system drags down a society.

121. TogoStrengths: Work Force Participation; Weaknesses: Adult Illiteracy Levels, 122. BangladeshStrengths: National Debt; Weaknesses: Adult Illiteracy Levels, 123. Papua New GuineaStrengths: Unemployment Rate; Weaknesses: Adult Illiteracy Levels, 124. TuvaluStrengths: NI; Weaknesses: NI, 125. Sierra LeoneStrengths: Crime Rate; Weaknesses: Adult Illiteracy Levels, 126. GuatemalaStrengths: National Debt; Weaknesses: Poverty Level, 127. JordanStrengths: Crime Rate; Weaknesses: National Debt, 128. SurinameStrengths: Access to Electricity; Weaknesses: Unemployment Rate, 129. LesothoStrengths: NI; Weaknesses: Poverty Level, 130.BeninStrengths: Work Force Participation; Weaknesses: Adult Illiteracy Levels, 131. YemenStrengths: NI; Weaknesses: Poverty Level, 132. HondurasStrengths: Work Force Participation; Weaknesses: Crime Rate, 133. RwandaStrengths: Work Force Participation; Weaknesses: Poverty Level, 134. BulgariaStrengths: Adult Illiteracy Levels; Weaknesses: Poverty Level, 135. Cote d’IvoireStrengths: National Debt; Weaknesses: Adult Illiteracy Levels, 136. PakistanStrengths: Work Force Participation; Weaknesses: Adult Illiteracy Levels, 137. DjiboutiStrengths: NI; Weaknesses: Unemployment Rate, 138. SudanStrengths: Crime Rate; Weaknesses: Adult Illiteracy Levels, 139, MauritaniaStrengths: NI; Weaknesses: Adult Illiteracy Levels, 140. BarbadosStrengths: Adult Illiteracy Levels; Weaknesses: Poverty Level

Tier 8: Ranks countries 141 to 160, the curse of illiteracy shows up again; where most of these countries have a high rate of adults that have a hard time reading, writing, or counting.

Without those life-skills, it is impossible to sustain a healthier way to live or grow a family. Nevertheless, if a heart beats people will try to survive so they go to work. They live day, by day, which insuring these countries will have a vibrant and ready-to- go workforce as their strengths.

141. CameroonStrengths: Work Force Participation; Weaknesses: Child Mortality Rate, 142. EritreaStrengths: Work Force Participation; Weaknesses: Adult Illiteracy Levels, 143. Burkina FasoStrengths: National Debt; Weaknesses: Adult Illiteracy Levels, 144. CubaStrengths: National Debt; Weaknesses: NI, 145. BrazilStrengths: Access to Electricity; Weaknesses: National Debt, 146. AfghanistanStrengths: Work Force Participation; Weaknesses: Adult Illiteracy Levels, 147. NigerStrengths: Work Force Participation; Weaknesses: Adult Illiteracy Levels, 148. MadagascarStrengths: Work Force Participation; Weaknesses: Access to Electricity, 149. Tanzania– Strengths: Work Force Participation; Weaknesses: Poverty Level, 150. LiberiaStrengths: National Debt; Weaknesses: Adult Illiteracy Levels, 151. BurundiStrengths: Work Force Participation; Weaknesses: Poverty Level,152. ComorosStrengths: National Debt; Weaknesses: Unemployment Rate, 153. Marshall IslandsStrengths: NI; Weaknesses: NI, 154. SenegalStrengths: NI; Weaknesses: Adult Illiteracy Levels, 155. MaliStrengths: Work Force Participation; Weaknesses: Adult Illiteracy Levels, 156. UgandaStrengths: Work Force Participation; Weaknesses: Adult Illiteracy Levels, 157. BahamasStrengths: Access to Electricity; Weaknesses: National Debt, 158. GambiaStrengths: NI; Weaknesses: Adult Illiteracy Levels, 159. MozambiqueStrengths: NI; Weaknesses: National Debt, 160. ChadStrengths: Work Force Participation; Weaknesses: Adult Illiteracy Levels

Tier 9: Ranks countries 161 to 180, is a group of nations that shows an imbalance of government leadership.

Most of these countries’ strengths are their natural wealth. Their weaknesses are their abilities to reach their whole country. Maybe, it’s greed that separates them from trusting one another or poor communication skills due to a lack of educational development.

161. Central African RepublicStrengths: Work Force Participation; Weaknesses: Adult Illiteracy Levels, 162. Guinea,- Strengths: Work Force Participation; Weaknesses: Adult Illiteracy Levels, 163. CyprusStrengths: Adult Illiteracy Levels; Weaknesses: National Debt, 164. United Arab EmiratesStrengths: Work Force Participation; Weaknesses: Adult Illiteracy Levels, 165. Aruba (Neth.)Strengths: NI; Weaknesses: NI, 166. UkraineStrengths: Adult Illiteracy Levels; Weaknesses: Nation Debt, 167. Republic of MacedoniaStrengths: National Debt; Weaknesses: Unemployment Rate, 168. Niue (NZ)Strengths: NI; Weaknesses: NI, 169. TurkmenistanStrengths: Adult Illiteracy Levels; Weaknesses: Child Mortality Rate, 170. Trinidad and TobagoStrengths: Adult Illiteracy Levels; Weaknesses: Crime Rate, 171. GuyanaStrengths: Access to Clean Water; Weaknesses: Unemployment Rate,172. Puerto Rico (US)Strengths: Nation Average Age 40; Weaknesses: Work Force Participation, 173. PalauStrengths: Access to Clean Water; Weaknesses: Child Mortality Rate, 174. LebanonStrengths: Crime Rate; Weaknesses: National Debt, 175. Bosnia and HerzegovinaStrengths: Adult Illiteracy Levels; Weaknesses: Unemployment Rate,176. MalawiStrengths: Work Force Participation; Weaknesses: Adult Illiteracy Levels, 177. NamibiaStrengths: National Debt; Weaknesses: Unemployment Rate, 178. VanuatuStrengths: Crime Rate; Weaknesses: Adult Illiteracy Levels, 179. EthiopiaStrengths: Work Force Participation; Weaknesses: Adult Illiteracy Levels, 180. ParaguayStrengths: Work Force Participation; Weaknesses: Poverty Level

Tier 10: Ranks countries 181 to 203 unlike the countries in tier 9, half of these countries children grow up in war-torn nations. An explosion is a culture; going to school is a James Bond movie. So why send my child to school?

Poverty levels, high child mortality rates, and unclean living conditions separate these countries from the rest of the world. Went will the rest of the world care?

181. PalestineStrengths: Adult Illiteracy Levels; Weaknesses: Nation Average Age 20, 182. TongaStrengths: NI; Weaknesses: NI, 183. Bermuda (UK)Strengths: Child Mortality Rate; Weaknesses: Poverty Level, 184. Republic of the CongoStrengths: Work Force Participation; Weaknesses: Adult Illiteracy Levels, 185. BotswanaStrengths: Work Force Participation; Weaknesses: Adult Illiteracy Levels, 186. Equatorial GuineaStrengths: National Debt; Weaknesses: Child Mortality Rate, LibyaStrengths: National Debt; Weaknesses: Adult Illiteracy Levels, 188. IraqStrengths: Access to Electricity; Weaknesses: Adult Illiteracy Levels, 189. NicaraguaStrengths: Work Force Participation; Weaknesses: Poverty Level,190. Federated States of MicronesiaStrengths: NI; Weaknesses: NI, NigeriaStrengths: National Debt; Weaknesses: Adult Illiteracy Level, ZimbabweStrengths: Work Force Participation; Weaknesses: Access to Electricity,193. HaitiStrengths: Work Force Participation; Weaknesses: Adult Illiteracy Levels, 194. GabonStrengths: Access to Electricity; Weaknesses: Poverty Level, 195. Guinea-BissauStrengths: Work Force Participation; Weaknesses: Poverty Level, 196. AngolaStrengths: Work Force Participation; Weaknesses: Nation Average Age 16, 197. SyriaStrengths: Access to Electricity; Weaknesses: Poverty Level, 198. ZambiaStrengths: Work Force Participation; Weaknesses: Adult Illiteracy Levels, 199. KosovoStrengths: National Debt; Weaknesses: Work Force Participation, 200. Democratic Republic of the CongoStrengths: Work Force Participation; Weaknesses: National Debt, 201. AndorraStrengths: NI; Weaknesses: NI, South SudanStrengths: NI; Weaknesses: Adult Illiteracy Levels, 203. SomaliaStrengths: NI; Weaknesses: Child Mortality Rate

2020 is gone. It left a mark on history. Where do we go from here? What countries will survive and thrive? The right answer is those who can educate their next generation and those who cannot.

Help us Change the World. A Smarter World…A Greater World: the World Top 20 Project

Learn How Here